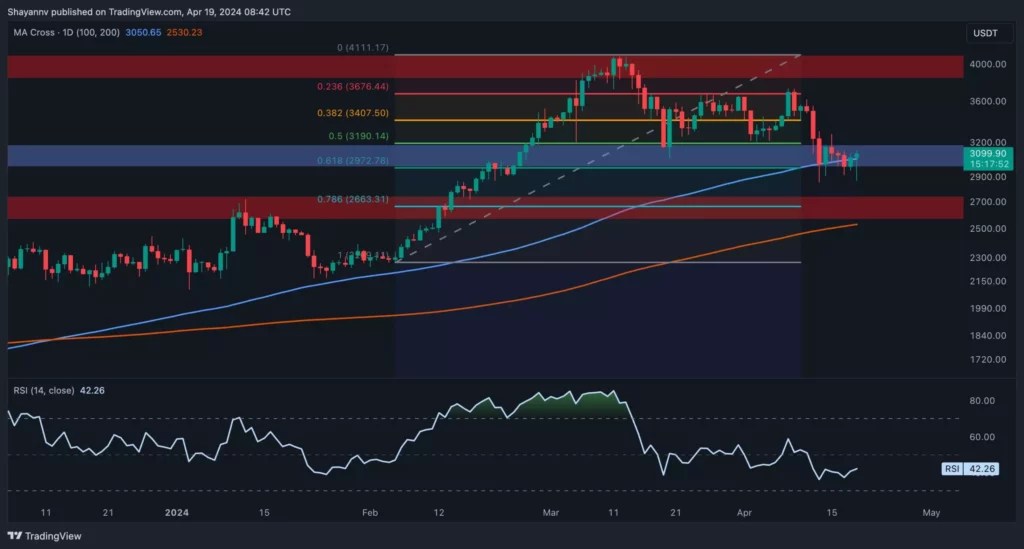
Ethereum has recently experienced a rapid downturn, causing concern among investors and traders in the cryptocurrency market. However, a more in-depth analysis of the daily chart reveals a potential silver lining for Ethereum. The price of Ethereum has found support within a substantial zone, which includes the 100-day moving average at $3050 and the critical price range between the 0.5 ($3190) and 0.618 ($2972) Fibonacci levels. This support zone holds significance as it has the potential to attract demand and prevent further downward pressure from market sellers.
Moreover, a minor bullish divergence between the price and the RSI indicator adds to the optimism for a potential bullish rebound. This divergence indicates the possibility of a resurgence in bullish momentum, with a target set at reclaiming the $3.5K threshold. However, it is essential to note that a breach below this critical support zone could trigger a cascading effect, pushing the price towards the 200-day moving average at $2.5K. Therefore, it is crucial for Ethereum to maintain its current support level to avoid further downside risk.
Descend Wedge Pattern and Buyers’ Strength
A closer examination of the 4-hour chart reveals a descending wedge pattern forming during a multi-month consolidation correction period. The price of Ethereum has reached the lower boundary of the wedge and is currently hovering around the support region at $3K. Despite the recent decline, the price has entered a consolidation phase with minimal volatility, indicating a balancing act between buyers and sellers in the market.
Furthermore, a noticeable divergence between the price and the RSI indicator on the 4-hour timeframe suggests the strength of buyers, hinting at a potential bullish upswing in the medium term. If the buyers manage to maintain their momentum, the next target for the price would be the critical resistance level at $3.5K. However, a break below the current support could lead to a descent towards the $2.7K support level.
Funding Rates and Market Sentiment
In analyzing Ethereum’s recent price movement, it is essential to consider whether the resurgence in price is driven by spot buying or leveraged futures activity. One key metric to evaluate this analysis is the funding rates, where positive values indicate bullish sentiment and negative values signify fear in the market.
Observing the recent downtrend in Ethereum’s price, it is evident that the funding rate metric has followed a similar trajectory, steadily declining until reaching near-zero levels. This alignment suggests that the recent price drop has resulted in the liquidation of a significant number of positions in the perpetual market, leading to a cooling effect on the futures market. As a result, the market now appears ripe for the re-emergence of long positions, potentially fueling a fresh upward surge in Ethereum’s price.
Ethereum’s recent price movement and future outlook exhibit a mix of challenges and opportunities for investors and traders. While the support zone and bullish indicators hint at a potential rebound, factors such as funding rates and market sentiment will continue to play a significant role in determining Ethereum’s price direction in the coming days. Investors and traders should closely monitor these key indicators and adapt their strategies accordingly to navigate the evolving cryptocurrency market landscape.


Leave a Reply